ISB Logo BioTapestry Caltech Logo

BioTapestry Web Client Quick Start


Contents

Levels of Network Models

Time Slider

Viewer Toolbar

Selecting Network Elements

Information About Genes

Information About Links

Operations on Regions

Overlays and Network Modules

User Paths

Pathing Display

Footnotes

Levels of Network Models

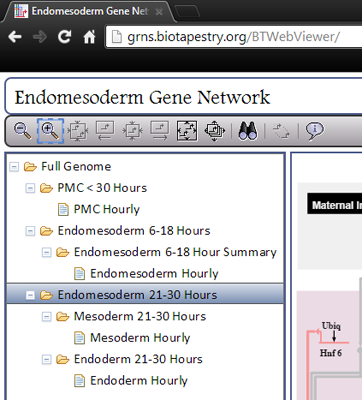
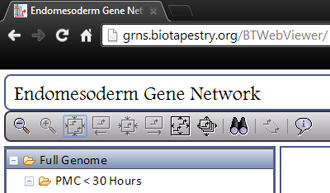
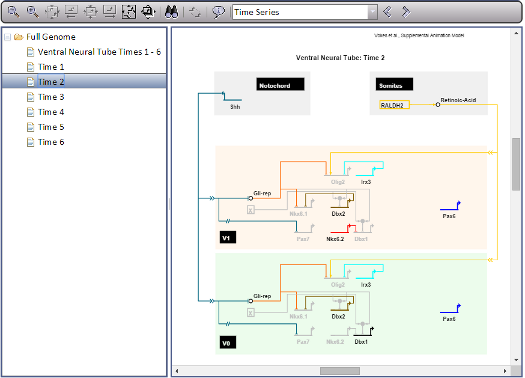
BioTapestry organizes a network model in a hierarchical series of models and sub-models, and displays this hierarchy in a tree view on the left side of the browser window. You can choose the model you want to view by clicking on it in the tree view.

Back to the top.


Time Slider

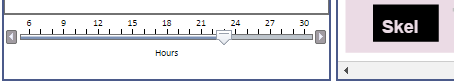
Whenever an "hourly" view is selected (the lowest level in the hierarchy), the viewer displays a time slider in the lower left corner that allows you to select the hour you wish to view by dragging the slider. Clicking the arrow 'bumper' to the left or right of the slider also moves it one increment per click.

Back to the top.


Viewer Toolbar

The BioTapestry Viewer toolbar provides several important functions. As shown in the picture at left, there are buttons for (going left to right) zooming out one step, zooming in one step, zooming to all selected items (only active if something is selected), cycling backwards through the selected items (only active if multiple items are selected), zooming to show the current selected item (only active if multiple items are selected), cycling forwards through the selected items (only active if multiple items are selected), zooming to view the current model, zooming to bound all the models in the hierarchy, searching for genes/nodes, clearing current selections (only active if something is selected), and viewing the about dialog.

Back to the top.


Selecting Network Elements

To select a gene, node, or link segment, just click on it. For genes, make sure to click in the areas highlighted in orange shown in the picture at left: either the gene name or the gene itself. To select more than one thing, hold down the Shift key while clicking on each new item. Use the Clear Current Selections toolbar button to clear all current selections, or, click on an empty section of the model.

Back to the top.


Information About Genes

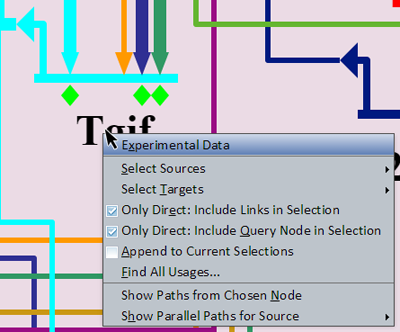
Right-clicking on a gene brings up a menu of options for that gene (see picture at left). (Note to Mac users: If you're using a one-button mouse, press the Control key while clicking the mouse to do this.) Make sure to click in the areas highlighted in orange shown in the picture in the previous section: either the gene name or the gene itself. (If you miss these areas, you will instead activate the menu for the underlying region or an inbound link.) Also, trying to select genes that are grayed out with no active inputs or outputs will not bring up this menu. Possible operations are:

  • Experimental Data: This will pop up a window that shows any associated information for the gene.
  • Select Sources: This is used to select the sources that have inputs into this gene, and has two sub-options, Select Only Direct Sources (will not pass through other nodes), and Pass Thru Nodes to Select Gene Sources (will pass through other nodes to reach source genes).
  • Select Targets: This is used to select the targets of this gene, and has two sub-options, Select Only Direct Targets (will not pass through other nodes), and Pass Thru Nodes to Select Gene Targets (will pass through other nodes to reach target genes).
  • Only Direct: Include Links in Selection: For the 'Select Only Direct' sub-option of Select Sources and Select Targets, checking this box will cause any links between the source or target to be selected as well. This is an application-wide setting.
  • Only Direct: Include Query Node in Selection: For the 'Select Only Direct' sub-option of Select Sources and Select Targets, checking this box will cause the query node (node which opened this popup) of the source or target to be selected as well. This is an application-wide setting.
  • Append to Current Selections: Checking this box will cause any new selections which result from a command to be appended to current selections rather than replacing them. This is an application-wide setting.
  • Find All Usages...: This will pop up a dialog that lists all the other places where the gene appears. Select a list entry and then click on the Go to Selected Node button to zoom to the other places the gene appears.
  • Show Paths from Chosen Node: Enables a click-selection mode (turning the cursor into a crosshairs) allowing the selection of a node from which to find any indirect paths to the source node, should they exist. A display (new window if allowed, otherwise a dialog in the current browser window) will open listing the possible paths.
  • Show Parallel Paths for Source: A submenu allows you to choose from the list of all inputs into the gene. Choosing one of these inputs will bring up a display that shows alternative indirect paths from the source to the target.

Back to the top.


Information About Links

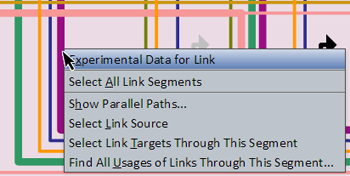
Right-clicking on a link segment brings up a menu of options for that link (see picture at left). (Note to Mac users: If you're using a one-button mouse, press the Control key while clicking the mouse to do this.) Possible operations are:

  • Experimental Data for Link: This will pop up a window that shows any associated information for the link. If more than one link passes through this segment, a dialog with a drop-down allowing for selection of a specific link segment will open first.
  • Select All Link Segments: This will select the entire tree of links for the link source. You can then use the Zoom to Selection toolbar button to see the whole tree in the view.
  • Show Parallel Paths...: This works like the Show Parallel Paths for Source option for genes (see above). It is only active if you click on a link segment that does not branch before reaching its single target.
  • Select Link Source: This will select and zoom to the source of the link.
  • Select Link Targets Through This Segment: This will select and zoom to the targets of the links that are downstream of the clicked-on segment (this is usually not the same as all the targets of the link source).
  • Find All Usages of Links Through This Segment...: This is very much like the Find All Usages... option for genes (see above), except it gives a list of links that are passing through the clicked-on link segment.

Back to the top.


Operations on Regions

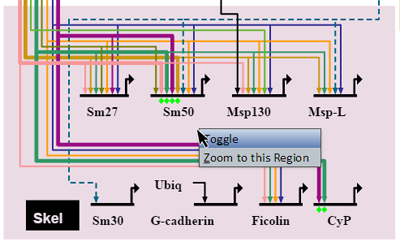
Right-clicking on a colored region brings up a menu of options for that region (see picture at left). (Note to Mac users: If you're using a one-button mouse, press the Control key while clicking the mouse to do this.) Possible operations are:

  • Toggle: Toggles the region to hide or show region contents.
  • Zoom to this Region: Zooms the view to bound the region.

Back to the top.


Transparent Overlay Opaque Overlay Underlay

Overlays and Network Modules

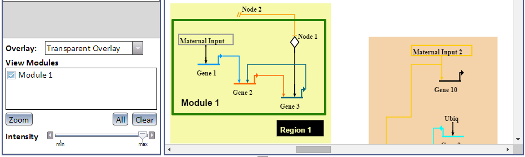
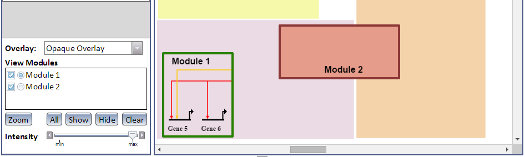
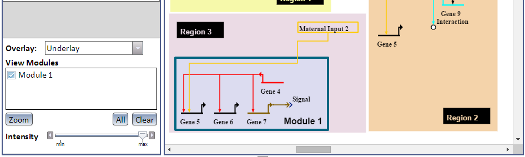
Overlays are a visual aid which allow you to draw rectangular boxes (called Network Modules) around nodes and links in a model. Different models may use different types of Overlays, or none at all, and a single Overlay can contain multiple Network Modules. Overlays can be one of three visual types, which effects how their Network Modules are displayed (see left image):

  • Transparent - Modules appear as border-only rectangular shapes (top left image). Nodes and links outside of active Transparent Network Modules continue to be displayed.
  • Opaque - Modules appear as filled rectangular shapes with distinct borders (middle left image) which can have their internal fill rendered transparent. Nodes and links outside of active Opaque Network Modules are not displayed unless the Intensity slider in the Overlay panel is lowered.
  • Underlay - Modules appear as filled rectangular shapes with distinct borders drawn beneath the nodes and links they enclose (bottom left image). Nodes and links outside of active Underlay Network Modules continue to be displayed.
Overlays are controlled via the Overlay panel, which is visible any time a network model which contains them is active (see left images, below the model hierarchy tree). The Overlay panel contains the following controls:
  • Overlay: A drop-down box that determines which Overlay is currently active. Only one Overlay and its Network Modules can be displayed at a time. A 'None' option is always available should you not wish to have an active Overlay.
  • View Modules: A checkbox listing of the Network Modules in the currently active Overlay. If Overlay is set to 'None' this box will be empty. The checkboxes control if a Network Module is active and drawn (checked) or not (unchecked). In the case of opaque Overlays, there will also be a radio button for showing (checked) and hiding (unchecked) the contents of a Network Module. If a Network Module is not active or if it is active but the Intensity slider (see below) is set to under 0.5, the radio button's setting cannot be changed. The radio button's status of 'show' (checked) overrides the Intensity slider's value for purposes of determining exposure of an opaque Network Module's contents.
  • Zoom: Zooms to all active Network Modules (inactive if no Network Modules are active)
  • All: Checks (activates) all Network Modules for the currently active Overlay
  • Clear: Unchecks (deactivates) all Network Modules for the currently active Overlay
  • Show: Opaque Overlays Only - Checks the show/hide radio button for all currently active Network Modules
  • Hide: Opaque Overlays Only - Unchecks the show/hide radio button for all currently active Network Modules
  • Intensity: The alpha level used in drawing any active Network Modules. If this value is below 0.5, the opaque Network Module radio buttons become disabled, as do the Show and Hide buttons. On an opaque overlay, lowering the Intensity also exposes the parts of the model which are not part of an active Network Module, where as normally they would be hidden.

Back to the top.


User Paths

User Paths allow you to create a 'path' stepping forwards and backwards through different levels and models in your network model. They are useful for showing a specific route through your network model, and can incorporate Overlay settings and use specific time point settings in models which have them. If a model has User Paths defined, a new drop-down and arrow buttons will be visible on the toolbar to the right of the About button (see image at left). To disable any current User Path, set the drop-down to 'None'. While the drop-down is set to 'None', the forward and back arrow buttons will be disabled. Clicking on either button will advance you one step forwards or backwards along the path.

Back to the top.


Pathing Display

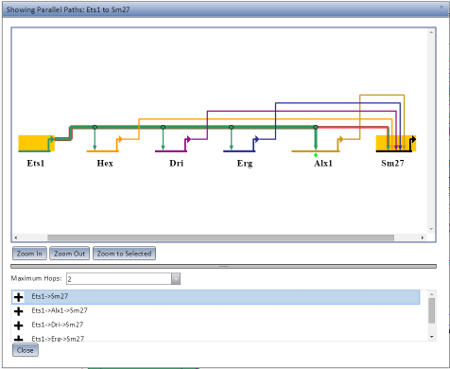
The Pathing Display opens when you choose Show Parallel Paths from Source or Show Parallel Paths from Chosen Node from the Gene Information pop-up. It will preferentially open as a new browser tab or window if it can (depending on your browser settings), but if not it will open as a dialog in the current browser window. An example of the Pathing Display open as a dialog is visible at the left.

The pathing model displayed will show all nodes along the possible route, with the current route highlighted in selection colors. There are three zoom options (Zoom In, Zoom Out, and Zoom to Selected) which behave the same as in the main application display. The maximum number of hops to allow for a potential route can be set using the Maximum Hops drop-down. A given rooute can be highlighted by selecting it from the list below the Maximum Hops limit.

Back to the top.


Footnotes

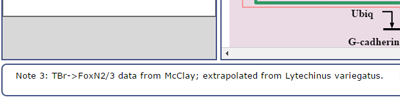
Footnotes describing features of the network diagram are shown as red numbers. If you move your mouse over the footnote, the associated text will be displayed in the box at the bottom of the BioTapestry window (see picture at left). Clicking on the note will keep the text displayed even if you move your mouse elsewhere.

Back to the top.


Last updated: January 14, 2015